The Campbell Prediction System Applied to Prescriptive (Rx) Burning
CPS was developed by recognized fire behavior analyst Doug Campbell in 1989, and implemented by the Ventura County Fire Protection District in 1992. The Campbell Prediction System or CPS, is a method of fire behavior prediction that is practical and simple. This system is designed to be used to manage fire intensities using a combination of logic, specific information relating to variations and their cause and the use of a special language to communicate with others. The CPS has replaced the old method of one person making a tactical decision and directing the firing and holding crews without them understanding the reasoning behind the orders. Now the entire team can and does make predictions of the variables and understands the reasons behind the directions given during the operations.
Ventura County Fire Protection District is currently relying on the CPS to select and test the tactics for wild land fires and prescribed burns. This has been the testing ground for using CPS on prescribed fires.
The objective of CPS is to predict the time and location of variations in fire intensity. Predictions allow firefighters to be mentally ahead of the situation and to adjust tactics before the fire changes. The prediction allows the selection of tactics that will use those variations to a winning advantage. Refining into a special language the intuition of highly experienced firefighters developed methodology for this system. Many of those veteran fire fighters knew fire behavior, but could not say how they knew. This situation is the result of trial and error from on the job training. CPS teaches how the experienced wild fire officer predicted fire behavior changes, and adds a language to communicate the knowledge. By doing so, CPS put into a training program much of the information learned by field experience enabling trainees to learn the art of prescribed burning much quicker and with less errors in the processes.
After the burn plan is approved there is much preparation and evaluation needed to assure a successful completion of the project. The following will take you through our thinking and planning to illustrate the processes the Wildland Fire Officer of Ventura County Fire Department has tested and adopted after some 20 projects were completed.
Using a Fire Intensity Window
To base the firing tactics on the fire behavior model is not logical. By that I mean that the model will not represent all the variables of fire behavior. The variables that occur cause the problems and on the other hand, are the answer to better accomplishment. There is much latitude given to the Firing Supervisor because of the need for the officers experience, in order to be successful. The experienced RX burn officer uses information gained from experience. This experience has taught the officer to be able to predict the outcome of putting the torch to the fuel. This experience has taught how to manage fire intensities so that the fire will burn hot enough to consume the desired amount of fuel and not escape control. Sometimes the difference between success and failure is a very fine line.
This skill has not been taught in school but rather limited to on the ground exposure. These, on the ground training opportunities, are extremely limited. Until one obtains experience one has not had an opportunity to learn the skills of managing fire intensities. It is important that a way is devised to enable the necessary skills to be taught as other skills are, in training classes. New information not contained in the burn plan is needed as well as procedures to take after the burn is determined a GO. CPS/Rx is the way to start identifying the new information and procedures that will advance the art of prescribed burning.
Improving the Burn Plan
Although the fire model describes the computed fire potential there remains a need to identify when and where the variations in the fire intensities will occur during the course of the burning operation. When fire variations are predicted and utilized in the tactical approach the operation these fire behavior variations and how to use the knowledge to accomplish error free prescribed burns. The information that is needed is not yet a part of the prescriptive burn plan but resides in the minds of the few experienced fire officers.
After the checklist is complete the final step to approving the start of the burn depends upon the area being within the RX window and remaining there. Contained within the RX window as it is called, are the elements of weather and the fuel. The acceptable range of the air temperature, humidity, fuel moisture live and dead, wind direction and speed comprise the elements in the prescriptive window. It is required that the values measured on site must be within this window in order to start the burn.
Close attention is paid to the weather; continuous readings are taken at various locations to assure the site remains within the RX window. If the conditions change and the values go out the window it is required the burn be stopped or a waver is granted to continue. If the fire escapes or fizzles and the burn managers have complied with the rules then the agency usually finds no fault with the personnel conducting the burn. It is the variation that causes the problems and the fire behavior model does not do an adequate job of describing the variations. This policy presumes that the variations within the approved RX window are not predictable. The use of CPS will add the variation predictions to the requirements prior to conducting the burn.
Since 1993 there have been some refinements that have helped to assure the successful completion of the prescribed burns in Ventura County. These are:
- Perimeter assessment planning.
- The firing sequence and timing plan.
- The Test burn analysis.
- Using fuel temperature variation as part of the Rx window.
- The Intensity prescription.
- The Escape Analysis.
- The use of shaded terrain maps and Solid Terrain Models.
- The Video Burn Logs.
The Perimeter Assessment
On perimeter of the primary boundaries of the burn, follow this principles: Ensure the exposure is “Out of Alignment” with slope or timing or wind.

|
The Firing Plan
How is the burning to be managed? The firing plan is written and a part of the burn plan document. How is the firing sequence and timing plan developed? Does the prescriptive window play a part or not? Does the BEHAVE fire model help determine the firing plan? What standard approach is recommended, or is there one at all? How is the firing plan evaluated? Who evaluates it? Will it work or fail? These questions are what the Operations people need to answer. If you are required to be responsible for prescribed burning you need to have answers to all the above questions.
The CPX/RX attempts to describe the elements of a firing plan in detail. Let’s start with identifying some additional information that is crucial to the success of any burning project. We will isolate information that is useful for fire behavior variation predictions. To be successful the firing plan must account for variations that change the fire intensity that could cause the burn to fizzle or cause it to suddenly race out of control. A competent fire officer should be able to determine the variance information is displayed and noted on the firing plan. The firing plan should show cause and affect which is the predictive information needed to assure the achievement of success. The question to answer is: “Does the firing plan include information and tactics that describe how the fire intensity will be managed?”
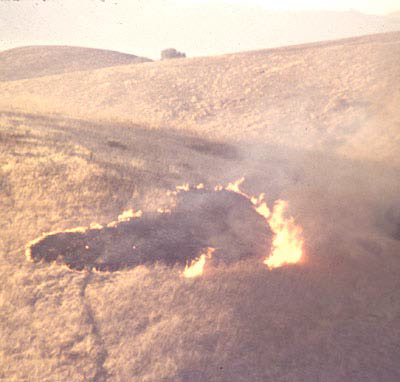 Test burn. From this scene the fire is proclaimed a go or no-go.
|
What Do We Want to Accomplish?
Each burn plan has a stated consumption objective. This objective calls for a percent of dead and live consumption reducing the fuel for whatever benefits are desired.
How is the consumption objective assured? The fire behavior model describes the mid point within a range of variation. This information is a fire danger description but not a fire behavior description. The average flame length and consumption is not usable information to determine how to create hotter or cooler fire. What information is it that will help us determine the variations of fire intensity and the consumption before we light the fire? We want to accomplish the ability to manage the intensity of the fire. We obviously need to use information that will be specific to the cause of fire behavior variations occurring while the weather is constant. What is apparent is that the fuel flammability is a variable under stable conditions. How can we use that knowledge?
Time and Aspect Considerations
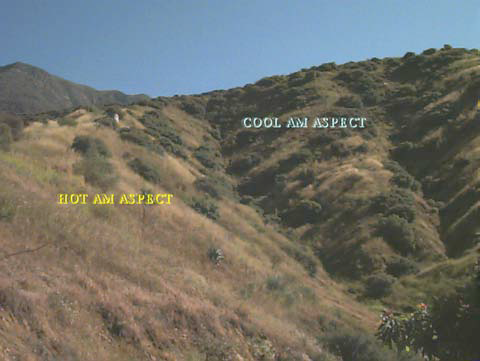
Hot and cold slope aspects in the morning
This knowledge of the peak periods of flammability can be used to set the timing of the ignitions for prescribed burns. The question to ask is, do you want the fuel to burn hotter or cooler than the model indicates it would? Do you want the fire intensity to be going up the curve or down the curve? How long will the fire burn with the intensity which will accomplish the consumption objective, where on the flammability curve will it began to burn to the objective and where will it not? Each aspect and time period must be considered as a variable in the potential intensity of the fire. If you want to be able to manage to a particular intensity during the burn than this information is what is needed. Each different aspect and time of burning will produce a variation in fire intensity and fuel consumption. Identify the intensity desired for each aspect and plan the time of firing according to the fuel flammability curve. You can show in the firing plan how to adjust the intensities to meet the demands of various archeological and botanical interests. These concerned people need to know and see evidence that the fire will not be loose and can be managed. Teaching is much quicker than experience.
Smoke Changes Fuel Flammability
Intensity variations are determined by how much sunlight is getting through the smoke to the fuel. Shading the fuel will change the intensity of the fire. Wind direction and the direction of burning are relationships that are important and need consideration. If you wish to dampen the intensity you can put smoke over the fuel, lowering the solar preheat factor and thereby the fuel flammability. If you wish to keep the fuel as preheated as possible, at it’s highest flammability, then you need to keep smoke from shading the fuels.
Fuel Flammability Variation in Single Plants
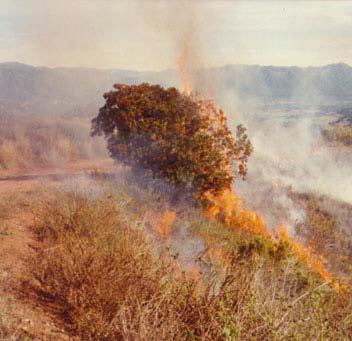
There are subtle variations in the shading within single plants that require close observation and attention. Each type of fuel except the very fine fuels such as grass, cause shade within the individual plant which affects the fuel flammability.
There are subtle variations that require close observation and attention. Each type of fuel except the very fine fuels such as grass, cause shade within the individual plant. Some fuels have little shading ability because of their porosity. Some with broad leaves or denser foliage shade themselves and parts of adjacent plants as well. There is a big difference in how much shade there is in a plant, as you’ll see if you compare a Sumac to a Chemise plant. The Sumac has a broad leaf and it creates a higher percent of shaded fuel within the plant. Each type plant has a different shading characteristic.
Thinking of fuel type as a stable element which burns with even intensity from plant to plant and on variations of the topography are dangerous in the fire profession. Determining the fire intensity from the normal descriptors of fuel is not useful to predict the variations that normally occur. Fuel type, arrangement, porosity, continuity, live model fodder. The conclusion leaves out the fuels range of flammability variation.
Learning to utilize fire behavior information to enable prediction of the level of variation of fire intensity is not as complex as you might imagine. The question to ask is “where is the fuel in its flammability curve?” When that question is answered, predictions are possible. Each fuel type has a different hot/cool quotient because of its structure. This quotient determines how much of the fuel can be preheated by solar energy. The more shade the plant can produce the greater the affect of the relationship of the heated fuel to the fire is.
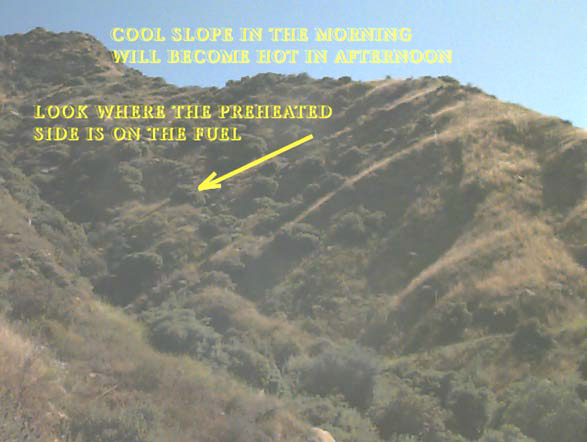
Cool slopes in the morning will become hot in the afternoon. Look for the preheated sides on the fuel.
If the fire is being carried by grass then as long as the sun is on the fuel the fuel is hot, there is no cool side to grass. If the fire is burning in brush or timber there is a hot and cool side in relation to the direction the fire enters the fuel. Fire burning into the hot side of the plant will burn hotter, consume more fuel and move on faster than when fire burns into the cool side of the plants. This alignment of the fire and the flammable side of the plant will be a factor in how the fire behaves. If you need to reduce the heat then light so the fire is not burning into the hot side of the plant. If you want to heat it up then fire the area so the fire enters the hot side of the plant. The firing supervisor should consider this tactic as another method to manage the intensity to a particular flame length that is that is most beneficial to the objectives for the fuel consumption.
The language to communicate what you want is simple. To heat up the fire, direct the firing crew to “ set fire in better alignment to the hot side of the bush”. To slow the fire, say, “Run the fire out of preheat alignment more.” It helps the burners to tell them how much flame you want to generate. Say, “Give me 15 feet of flame”. Avoid being vague in giving intensity directions; give them the desired flame lengths they are to accomplish.
The Firing Timing and Sequence
To develop improved timing and sequence of firing plans, the time, location and values of flammability variations need to be known. The temperature difference can be measured between shaded and sunlit fuels. Variations in fuel temperature are determined by the use of a temperature instrument that has two leads and will register surface temperatures. These instruments are readily available on the commercial market. The instrument reveals the temperature difference between sunlit and shaded fuels. Test fires will quickly identify the fuel temperature required to assure continued combustion. Even though the area is within the RX window, the fuel may not burn until its temperature has reached a certain point. That information is important to have before commencing the burning.
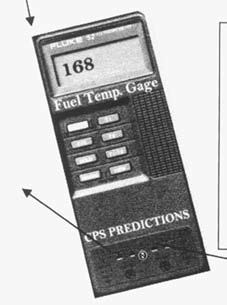
Infrared thermometer
The burn may fizzle in shaded fuel of a temperature of 70 degrees while at the same instant the fire will run and spot in hot fuel of a temperature 120 degrees. Normal temperature spread between hot and cool fuel while within prescriptive windows is 30 to 60 degrees Fahrenheit. Management of fire intensities is done using the knowledge of where and when there exist fuel temperature differences. When you want the maximum intensity light off hot fuel. The peak flammability period of various aspects can be identified and measured. Each aspect should have a time of optimal burning assigned it to assure flammability variations are predicted.
Should we be using calculations and fire modeling or test burns to determine the timing and sequence of burning? Picking the point on the flammability curve to start burning is crucial to success. Testing for the truth by use of a test burn is absolutely necessary to the process. The test burn evaluation will reveal the reality of the burning situation and get you off on the right foot. When the evaluation is complete, the time allowed for burning the various aspects will also be known. This is what establishes the timing, of the firing and burnout operation. The Sexton Rx burn done in October 12, 1995 was a case where the weather began in the morning with the air temperature and humidity below the window limits. Air temperature was in the high 50’s and the humidity was measured at 79% that was below the Rx window. At 0930 the sky was clearing and the temperature rose to 65 degrees and the humidity lowered to 66% and hung there for the rest of the day. The east aspect was selected for the test fire and a thirty-minute period was given the fuels to heat from solar radiation. The fuel temperature reached 120 degrees even though the air temperature and the humidity remained out of the Rx window. The test burn was lit and was declared a go for the burn. The cool fuel on the south and west aspects was 66 degrees, the differential was 54 degrees. The firing sequence and timing were to burn using fire aligned with the hottest slopes, following the sun around. Beginning with east aspects then south then west the burn went as planned. A video burn log was made of the entire sequence of events and is on file in the Wildland Fire Officer’s office.
How Fire Danger Affects Fuel Temperature
There is a distinct relationship between fire danger and variations in fuel temperature. At moderate fire danger, when the air is 80 degrees and the relative humidity is 40%, the range of fuel temperature might span only 30 degrees. During extreme fire danger of 105-degree air temperature and 10% relative humidity, the fuel temperature spread might be 70 or even 80 degrees.
The difference that fuel temperature variations cause in fire behavior can be quantified by observing fire intensity differences in hot and cold fuels that are on fire. These signatures are usable for predicting fire intensity during the burn. Test fires are the best method to establish these variations of fire intensity.
Our method considers the aspect and time as critical elements in the test. Performing a test burn without knowing whether it is hot fuel or cold fuel provides inadequate information. Such a burn would not reveal sufficient information to gauge the variables in fire intensity.

CPS Fuel Flammability Card
Most the test burns should be ignited when the fuel is at its peak flammability. This will reveal the maximum intensity potential of the fire burning under the current weather. A handy pocket card that depicts the generic fuel flammability curves for the 4 slope aspects.
The flammability card is a quick reference to use for prescribed and wild fire tactics planning. To ascertain if the fire behavior will be diminishing or accelerating, look at the flammability curve for your aspect. If that point on the curve is not yet at its peak, expect accelerating fire intensity. This can be communicated as “going up the curve.” The maximum fire potential intensity can be turned as “at the peak of the curve.” If the time indicates that the peak has occurred, we can say that the aspect is “going down the curve,” and that the potential flammability is diminishing with time.
If different fuel temperatures are causing significant intensity variations, follow these steps:
- If the aspect is not already on fire, locate the area on the card by aspect and time.
- Observe and note a place in the burning fire that is representative of the aspect of concern.
- This observed fire intensity reflects the potential intensity on the subject aspect.
Some prescribed burns have escaped because the test burn was evaluated when the fuels were below peak flammability. Such fires can easily escape because the maximum potential intensity remains unknown and lesser intensities were predicted.
Remember: Smoke shades fuel and temporarily affects the fuel flammability.
When firing the perimeter of the project, plan to fire these areas when the exposure is low on the flammability curve. Fire escapes are more easily controlled when they occur in COOL fuel. Burn the perimeter when the fuel inside the area is HOT and the exposure fuel is COOL.
The Fuel Flammability Map and Its Use
Another tool can help to visualize the relationship of aspect, time and fuel flammability difference. This tool is comprised of a contour map and a highlighting pen.
Campbell uses a fuel flammability map to identify the variations of fuel flammability for prescribed burns and wild fires. Terming the highlighting device a Yellowommeter, he highlights the hot aspects in either the morning or for the afternoon hours. This fuel flammability map makes it possible to communicate and visualize the times that fuel on the various aspects are potentially more flammable. In the afternoon from about noon to 5 o’clock, the colored areas are the western, flats and southern aspects. A morning map hot slope map would highlight the eastern aspects.
These Yellowommetered maps are now standard procedure for the Ventura County Fire Department. The timing of ignition is planned by considering the fuel flammability variations, in and adjacent to the burn area. The Yellowommeter map is also used as a tactic planning aid on wild fire incidents. This flammability map is an excellent visual aid that helps determine timing of certain tactics.
Copyright © 2010, 2017 by Doug Campbell.